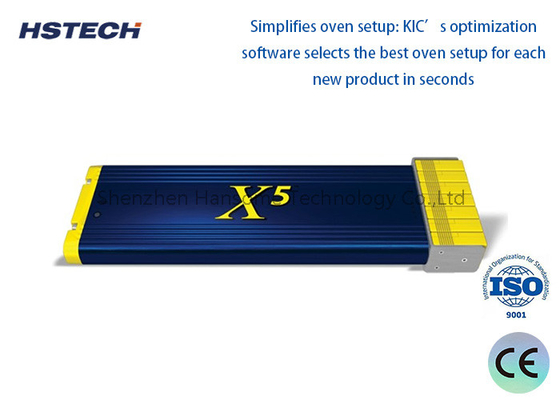
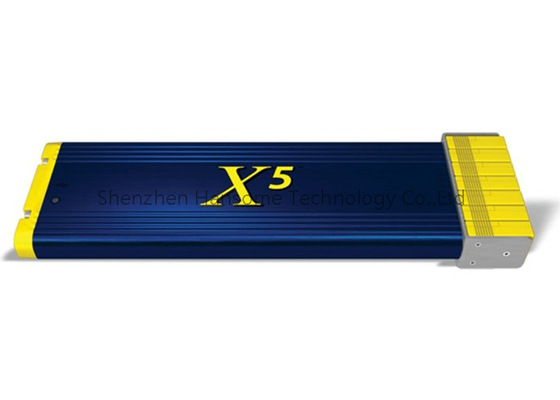
Brand Name: | KIC |
Model Number: | X5 |
MOQ: | 1 PC |
Price: | Negotiable |
Payment Terms: | T/T, Western Union, MoneyGram |
Supply Ability: | 500 pcs per month |
High Temperature Protection KIC X5 Thermal Profile Type K With 3 AAA Batteries
Introduce
Thermal Profile refers to the graph of temperature changes with time during heating or cooling. It is used to monitor and record temperature changes of an object or system and can be used to optimize the control and adjustment of heating or cooling processes.
Options and size
7 Channels : 206X60X17mm
9 Channels : 206X75X17mm
12 Channels : 206X98X17mm
Specifications
Model | KIC X5 |
Dimension | 7-channel: 206 x 60 x 17 mm,with shield: 302 x 75 x 23 mm 9-channel: 206 x 75 x 17 mm,with shield: 312 x 90 x 23 mm 12-channel 206 x 98 x 17 mm,with shield: 323 x 113 x 23 mm |
Accuracy | ± 0.5˚C |
Resolution | 0.1˚C |
Interal operating temp | 0˚C~85˚C |
Sample rate | 0.1 to 10 readings/sec |
Data points | 224,640 |
Data transfer | Standard model USB 2.0 (Std-A/Mini-B) after datalogging run RF model Wireless over RF (radio frequency 433.92 MHz), sent real-time during datalogging run, or via USB 2.0 (Std-A/Mini-B) after datalogging run |
Power | 3 AAA batteries, USB cable when connected to a computer |
Thermocouple Capacity | Type K, standard (7, 9, or 12, depending on model) |
Thermocouple Temperature Range | -150˚C to 1050˚C |
Thermal shield | Cool Touch Stainless Steel 7 or 9 channel |
Computer Configuration Minimum System Requirements |
Dual Core / 1 GHz processor PC w/2 GB RAM 2 GB available storage Video 1024 x 768 resolution, 16-bit 1 available USB port for data download 1 available USB port for software key |
Thermal curves typically contain the following elements:
Time axis: The horizontal axis of the thermal curve represents time, measured in seconds, minutes, or hours. A timeline helps us understand the duration and speed of temperature changes.
Temperature axis: The vertical axis of the thermal curve represents temperature, in degrees Celsius or Fahrenheit. The temperature axis shows the temperature values of an object or system at different points in time.
Heating/Cooling Phases: Thermal curves show the different heating or cooling phases that an object or system goes through. Each phase can have a different temperature change rate and duration.
Rate of Temperature Change: The slope of the thermal curve represents the rate of change of temperature. A steeper slope indicates a rapid temperature change, while a gentler slope indicates a slow temperature change.
Temperature Peak: The highest temperature point in the thermal curve is called the temperature peak. Temperature spikes can be used to determine whether an object or system reaches a desired temperature, and when it reaches its maximum temperature.
Thermal profiles play an important role in various applications.
For example, during the welding process, thermal profiles can be used to monitor welding temperature and time to ensure welding quality and reliability. In baked goods, thermal profiles can be used to determine the heating time and temperature of food to ensure food safety and taste.
By analyzing and optimizing thermal profiles, you can improve the efficiency, consistency and control of your heating or cooling process. This can be achieved by adjusting the parameters of the heating or cooling equipment, such as temperature setting, heating rate, holding time, etc.
It should be noted that different application fields and specific situations may require different thermal curve analysis methods and parameter settings. Therefore, before using thermal profiles for process control and optimization, it is recommended to have a detailed understanding of the application-specific requirements and related guidance.